Grab Nearby: discovering places with great offers around you
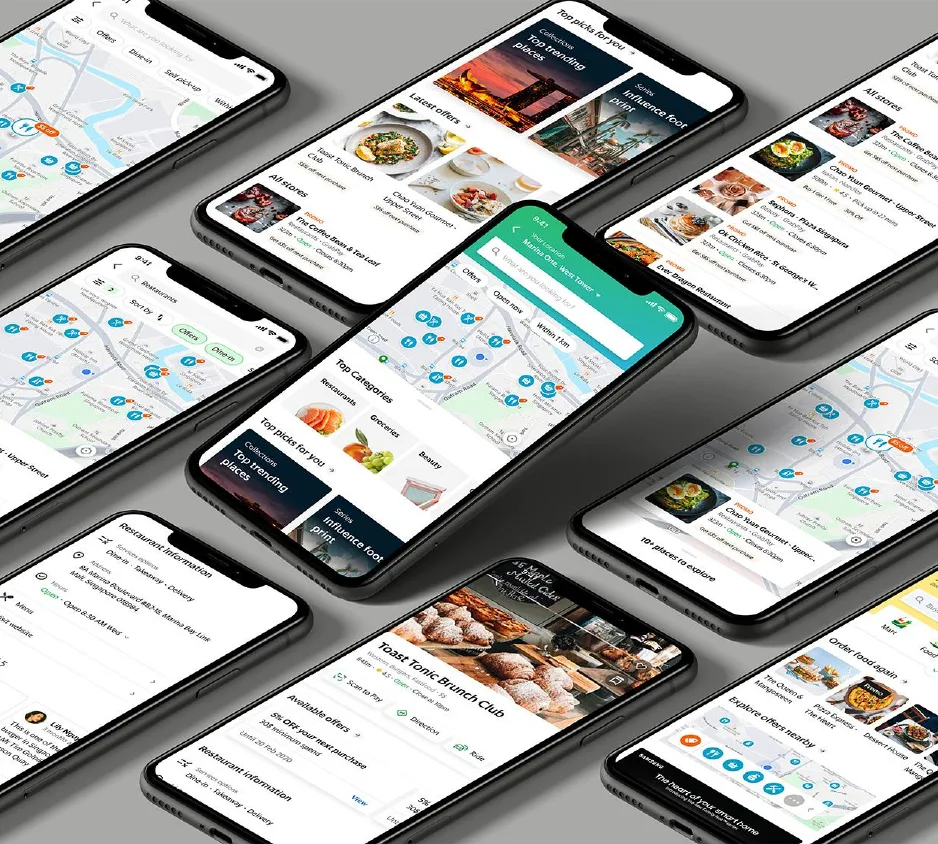
Grab wanted to be people's first choice for finding places nearby in Southeast Asia. I redesigned how users discover nearby stores and deals, through search, a map, categories and offers.
My role
Led the project end to end, ran workshops and prepared research with researchers. Tools: Figma and ProtoPie.
Team
1 designer (me), 2 PMs, 2 engineers, 4 QAs, a researcher and a content strategist, plus Homepage, Map and Food teams.
Impact
Revenue per user grew from $0.20 to $5.03 in the experiment.
Background
Discovery, incentive, purchase
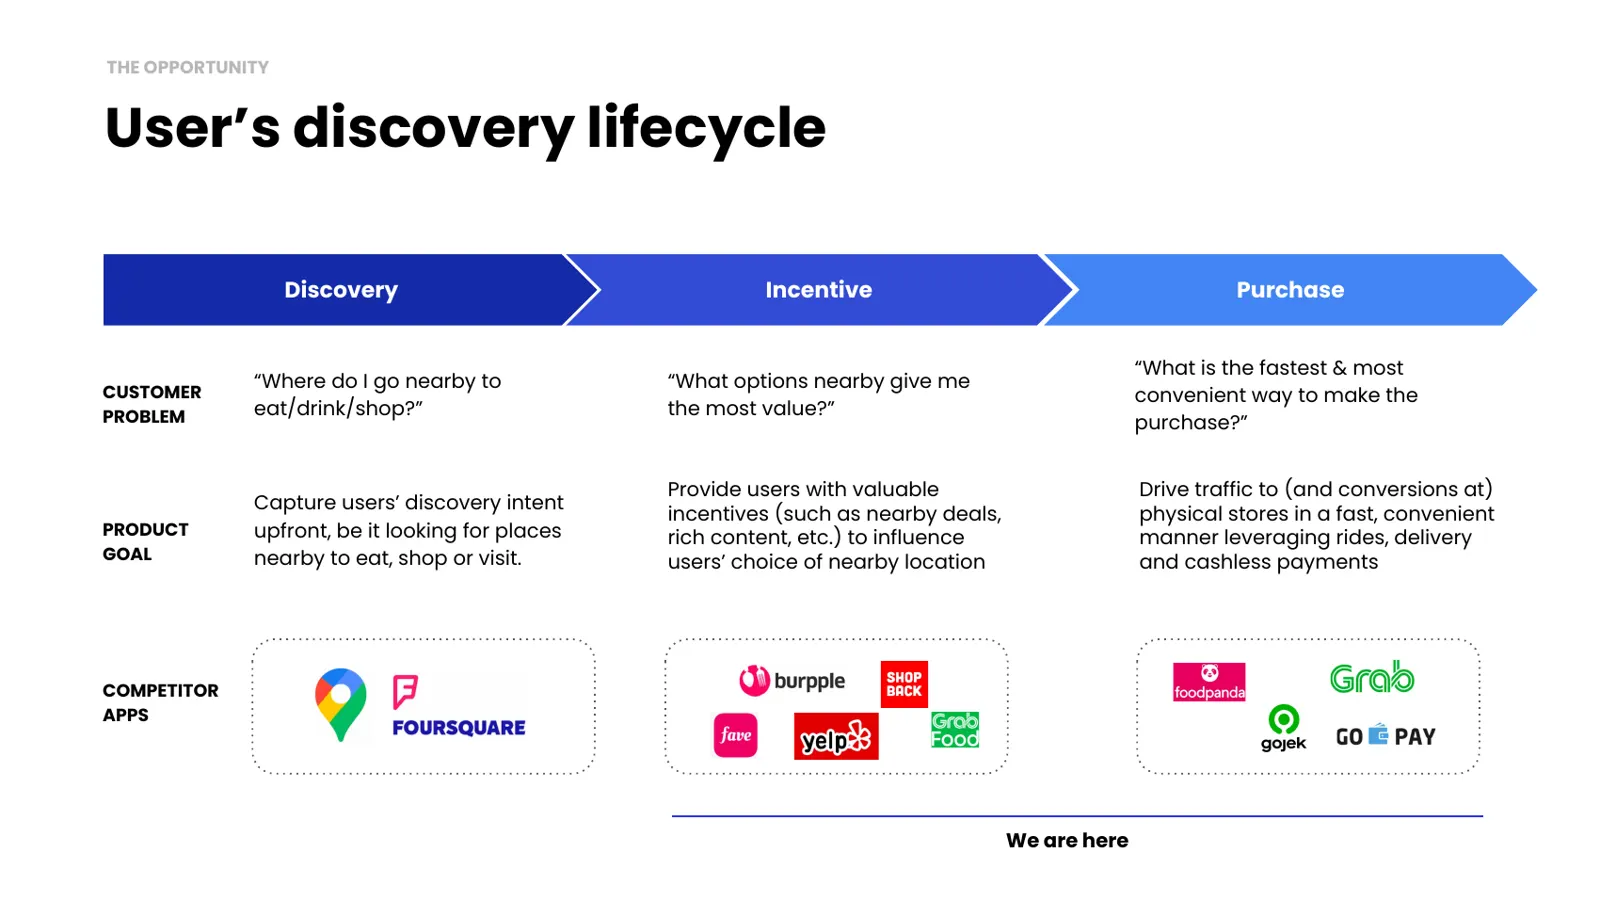
Users ask three questions: where should I go nearby, which option gives me the most value, and what is the fastest way to buy? The goal was to answer all three in one place.
The problem
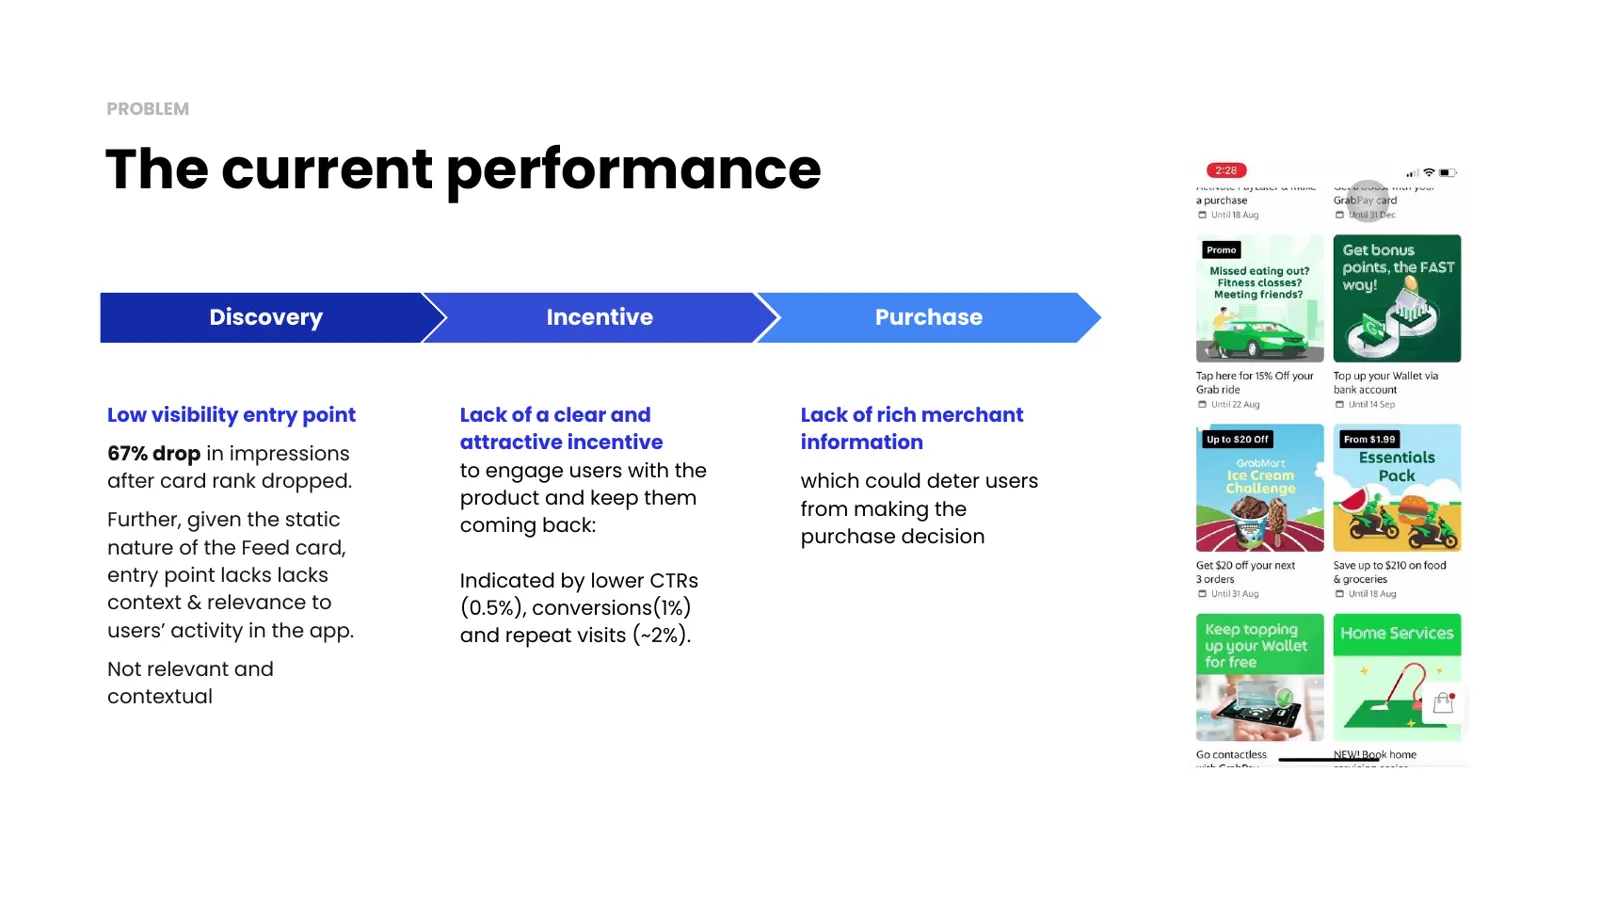
A hidden entry point with weak incentives
Impressions dropped 67% after the entry card lost its ranking. Click-through was 0.5%, conversion 1% and repeat visits about 2%. Stores also lacked the rich information people need to decide.
Problem spaces we’re tackling

Consumer
“I want to find all the merchants around me where I can receive benefits while I shop, such as offers, order ahead, PayLater and Pay with Points. Where should I look?”

Grab Merchant
Lack of ability to attract and retain customers: Merchants are unable to incentivise users to visit their physical stores and use GrabPay.
Lack of visibility: Customers can’t discover them on the Grab app unless they see the in-store point-of-sale collaterals. Even if they run promotions and deals with Grab, these are hidden somewhere in the app.
Users and goals
Active and passive customers
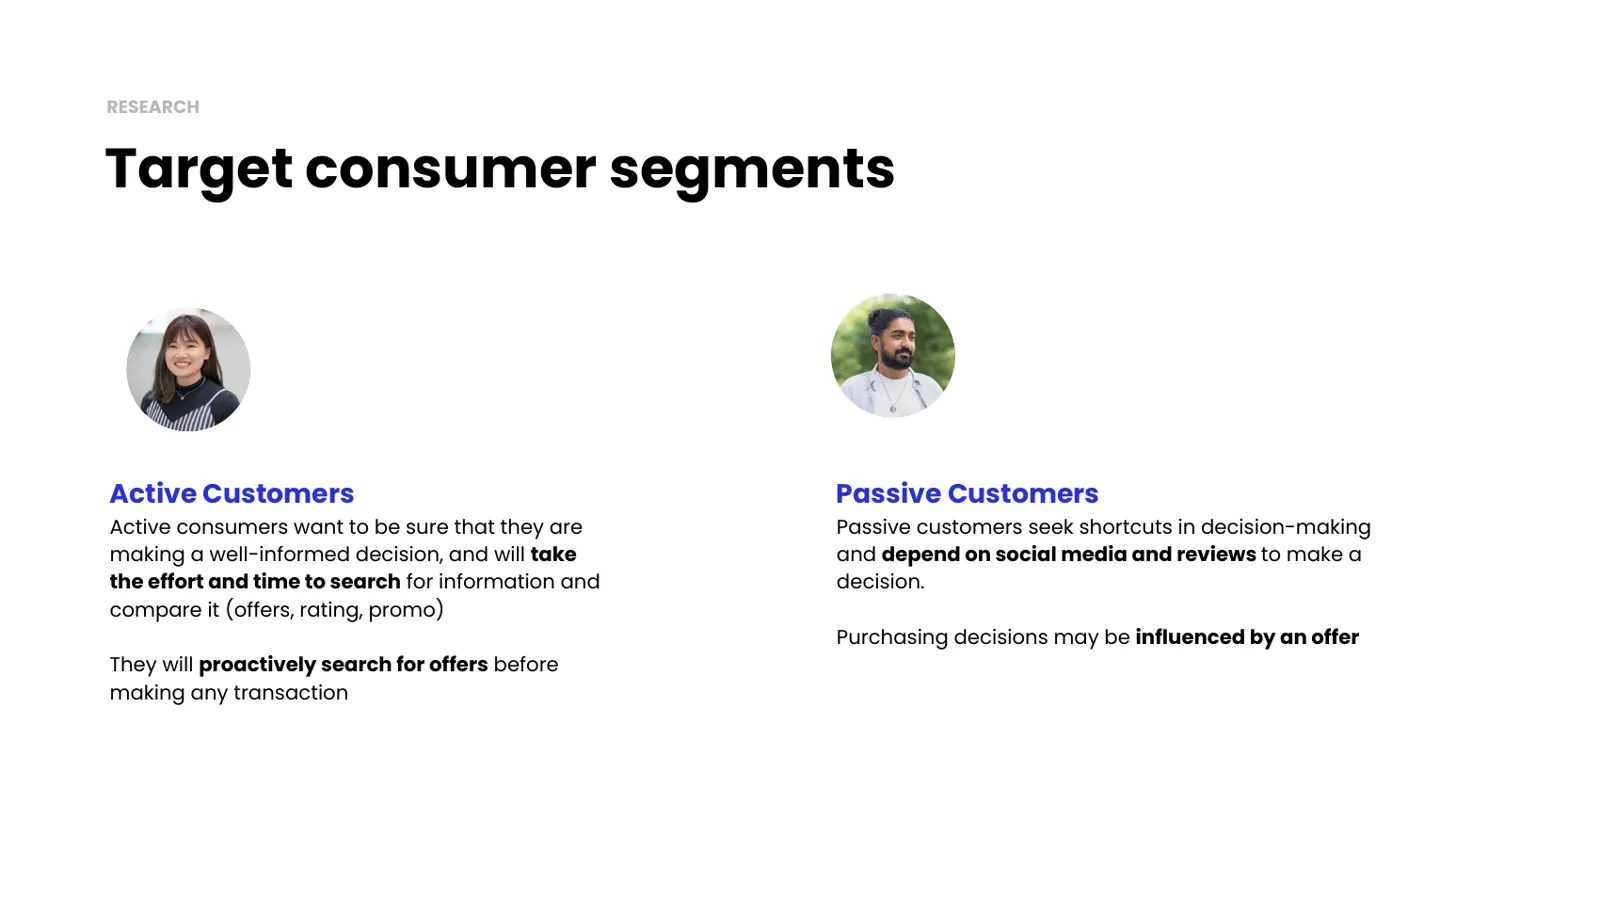
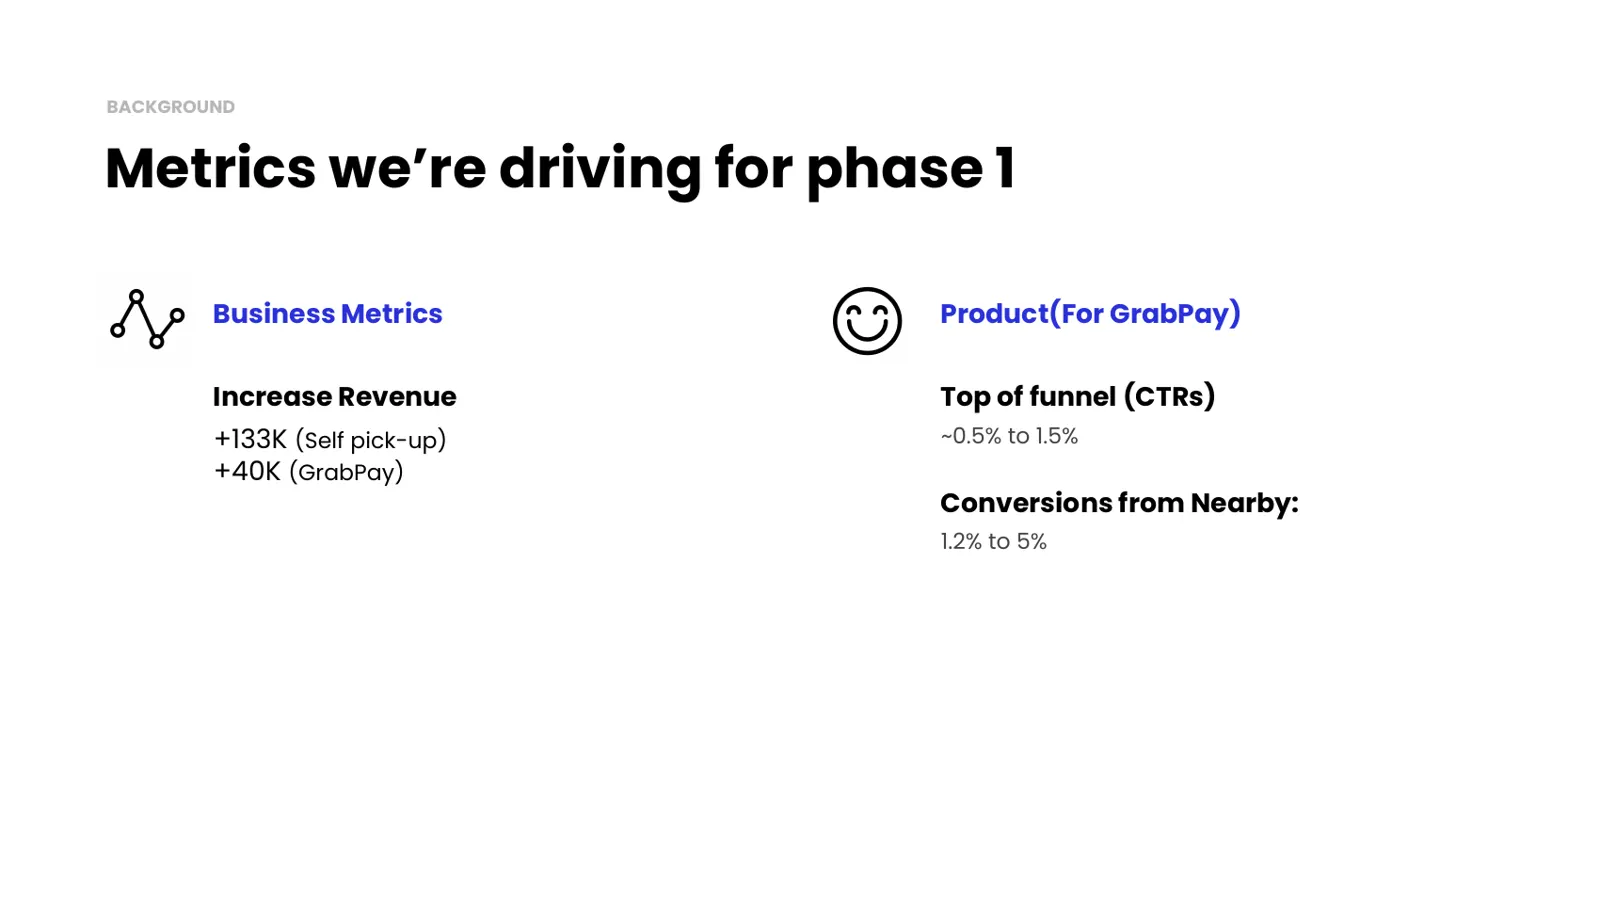
Active customers compare offers, ratings and promos before buying. Passive customers look for shortcuts and rely on reviews and social proof. Phase 1 aimed to raise click-through from 0.5% to 1.5% and conversion from 1.2% to 5%.
Visibility
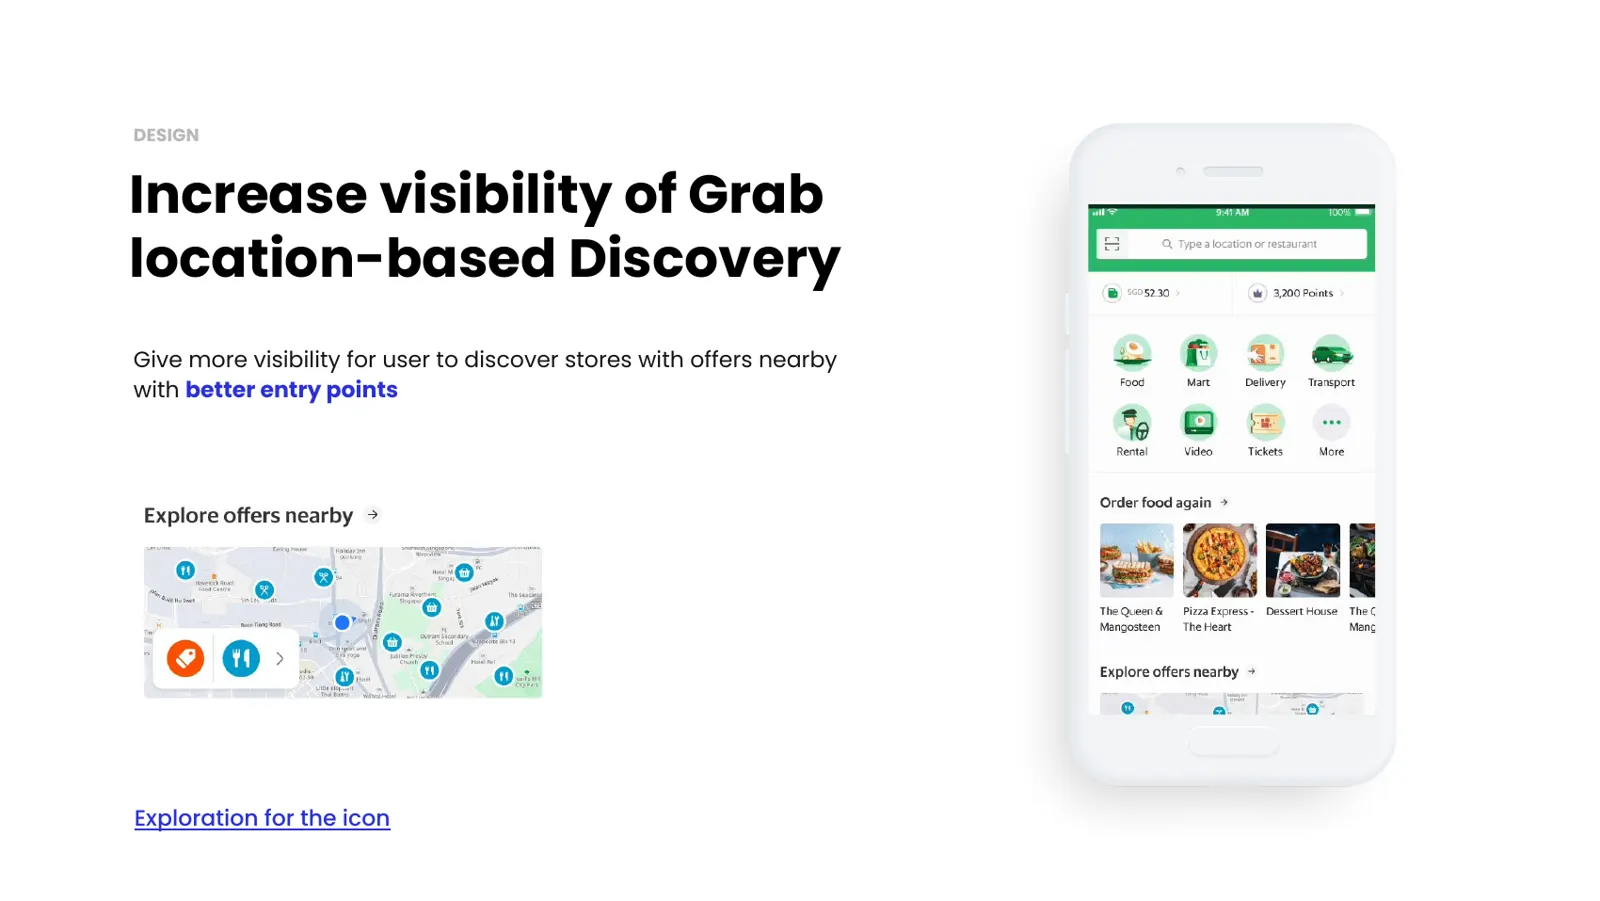
Better entry points
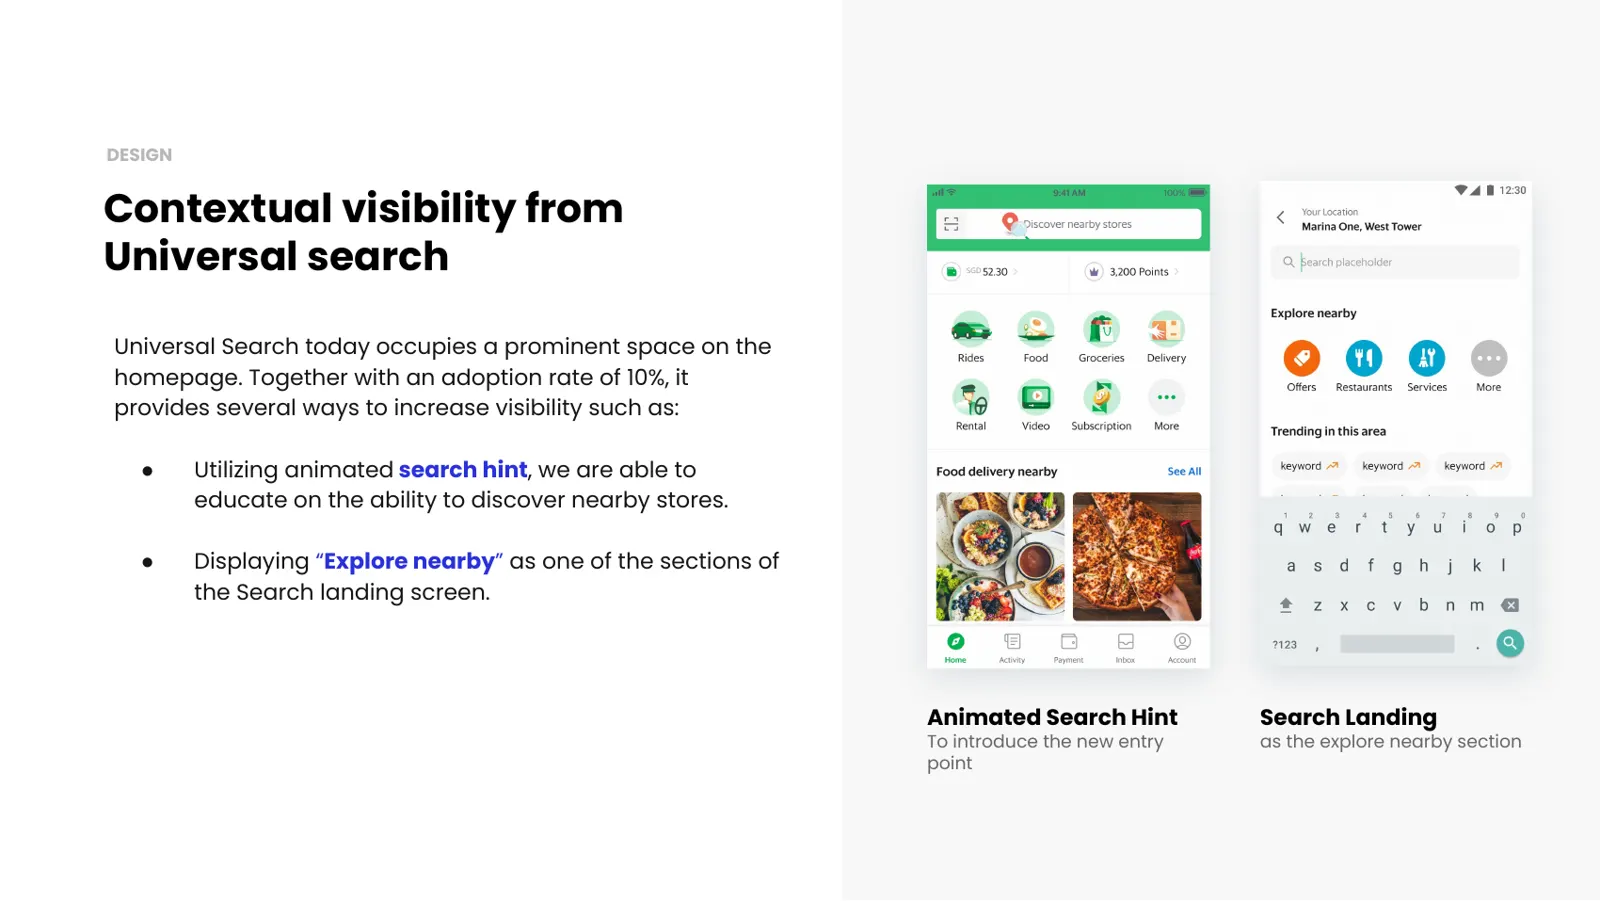
I added a new entry point and used universal search, which already had 10% adoption, with an animated hint and an Explore nearby section.
Incentives
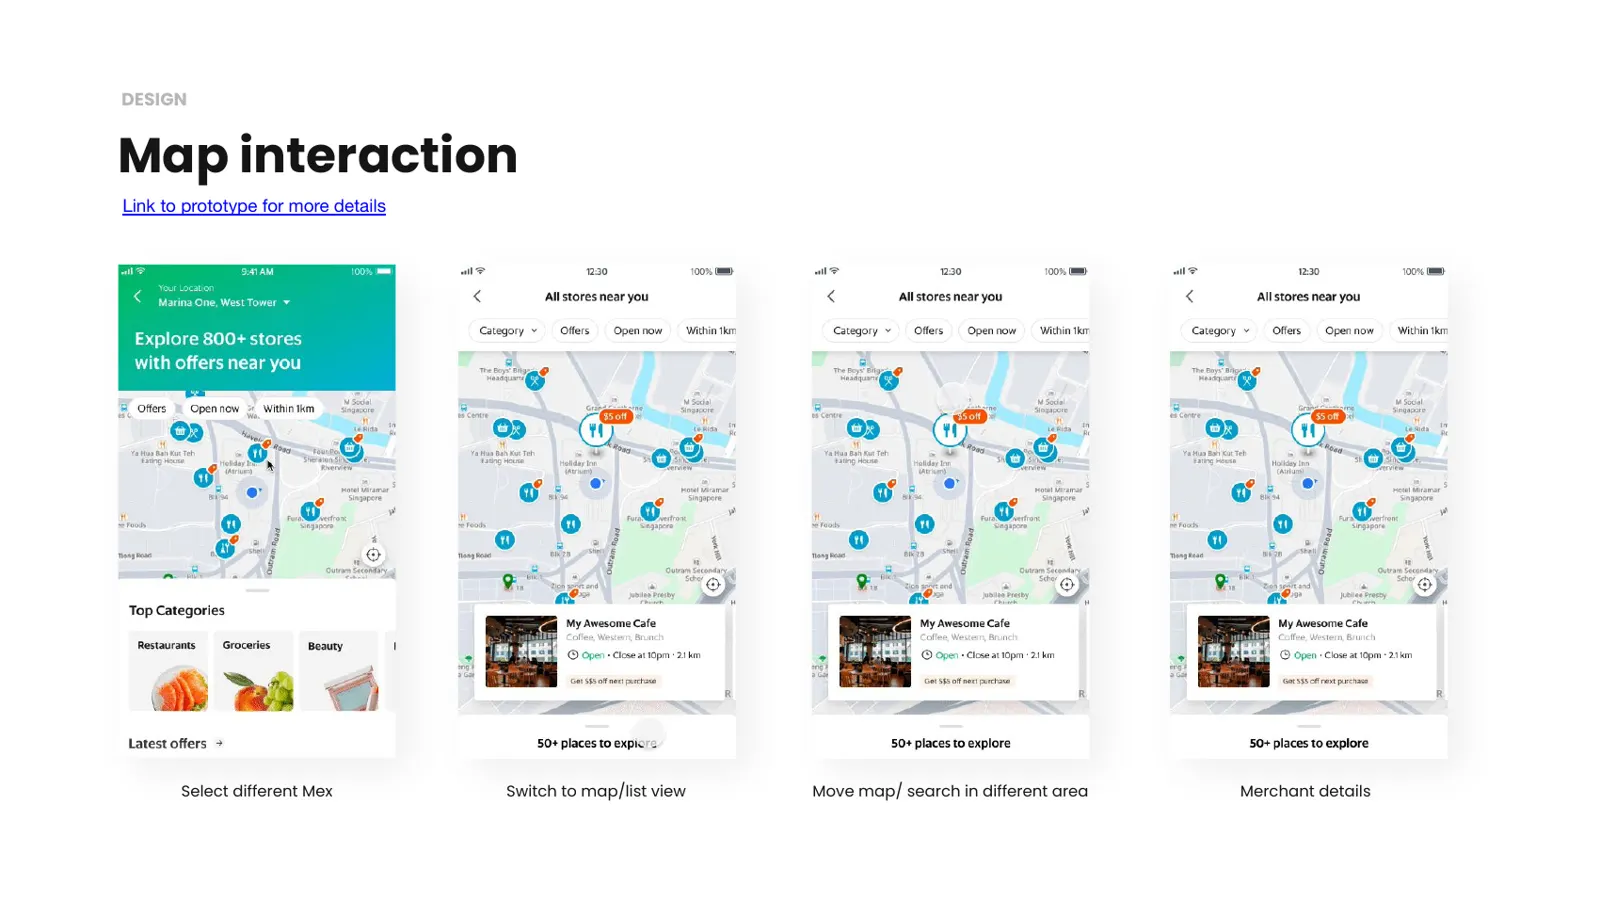
Discover through the map, categories and offers
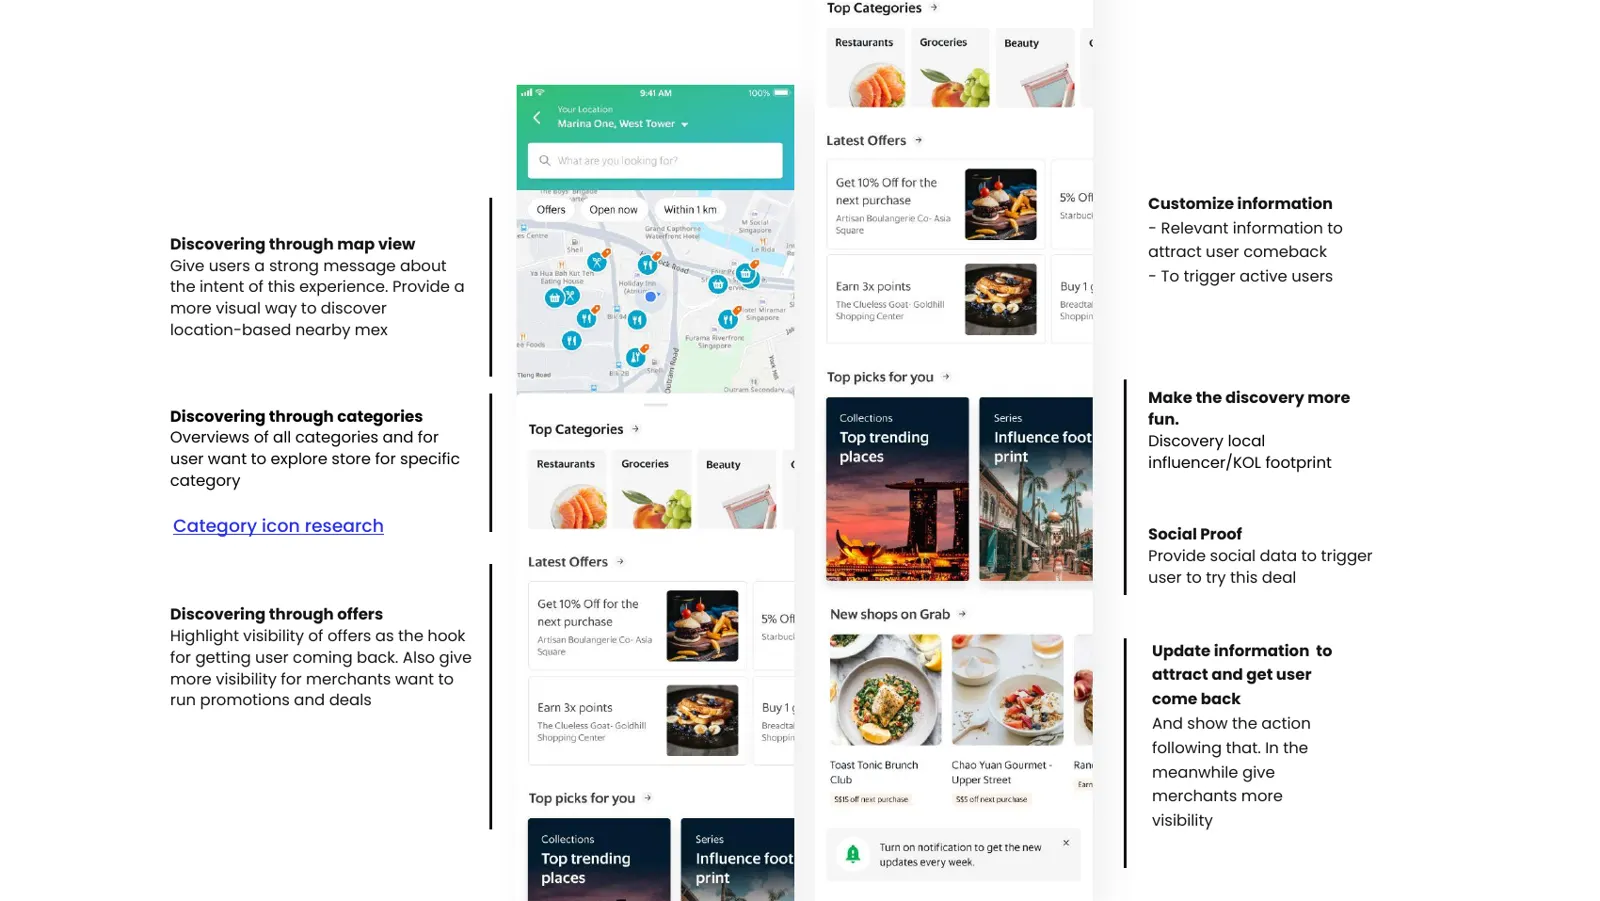
A map view makes discovery visual, categories help people with a specific need, and offers give users a reason to come back while giving merchants more visibility.
Purchase
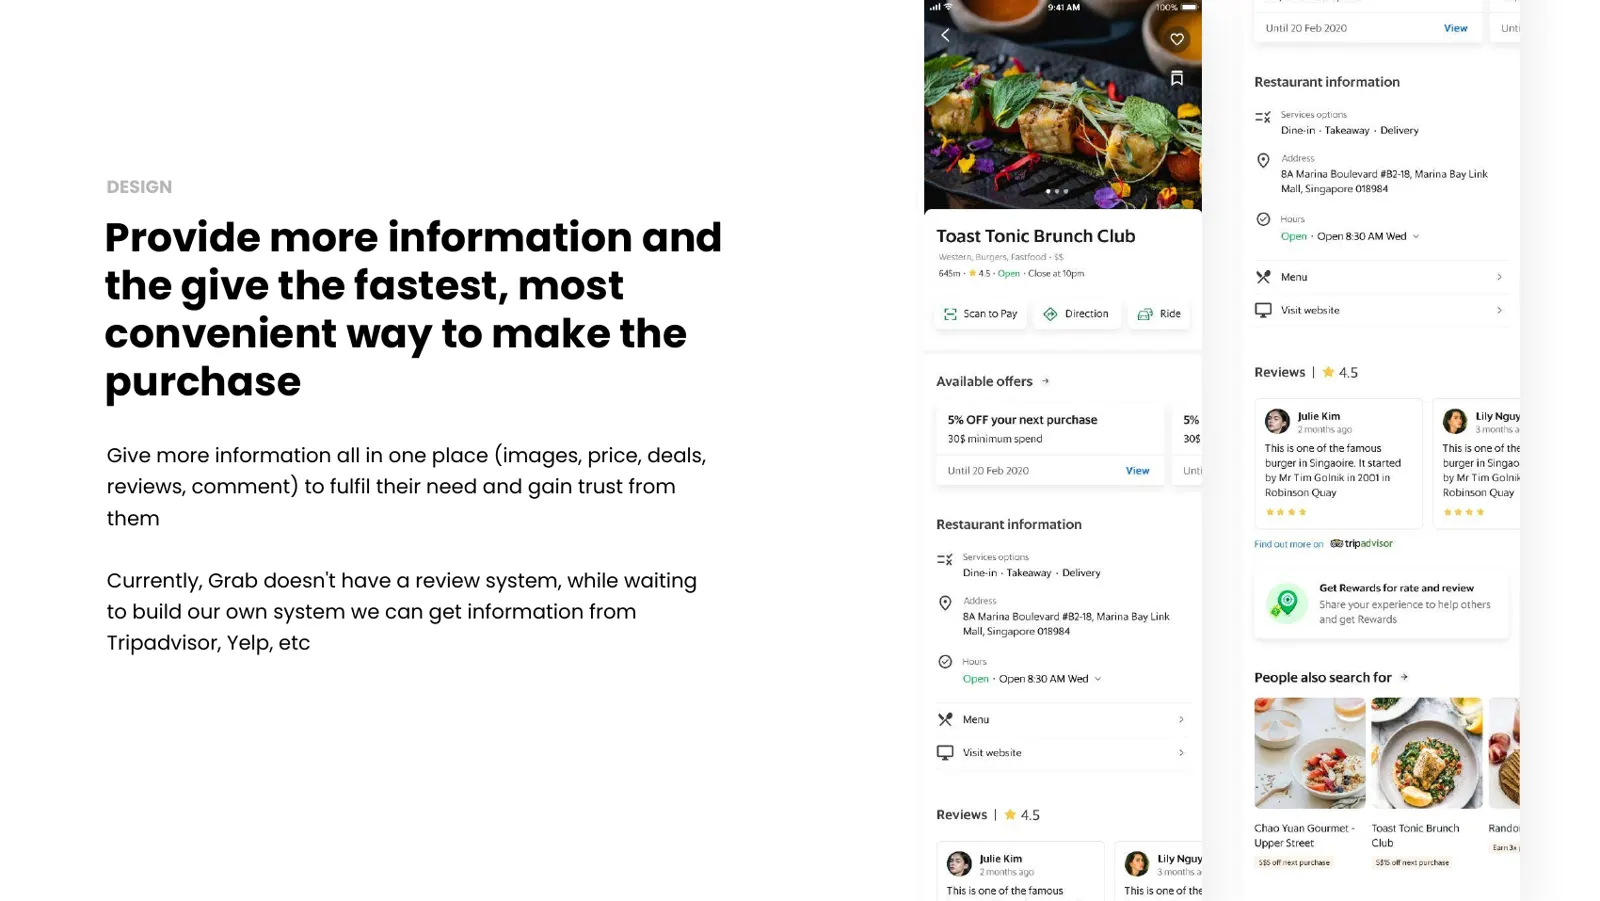
Everything needed to decide, in one place
Merchant pages bring together images, prices, deals and reviews. Grab had no review system yet, so we planned to pull information from sources like Tripadvisor and Yelp in the meantime.
Research
What users taught us
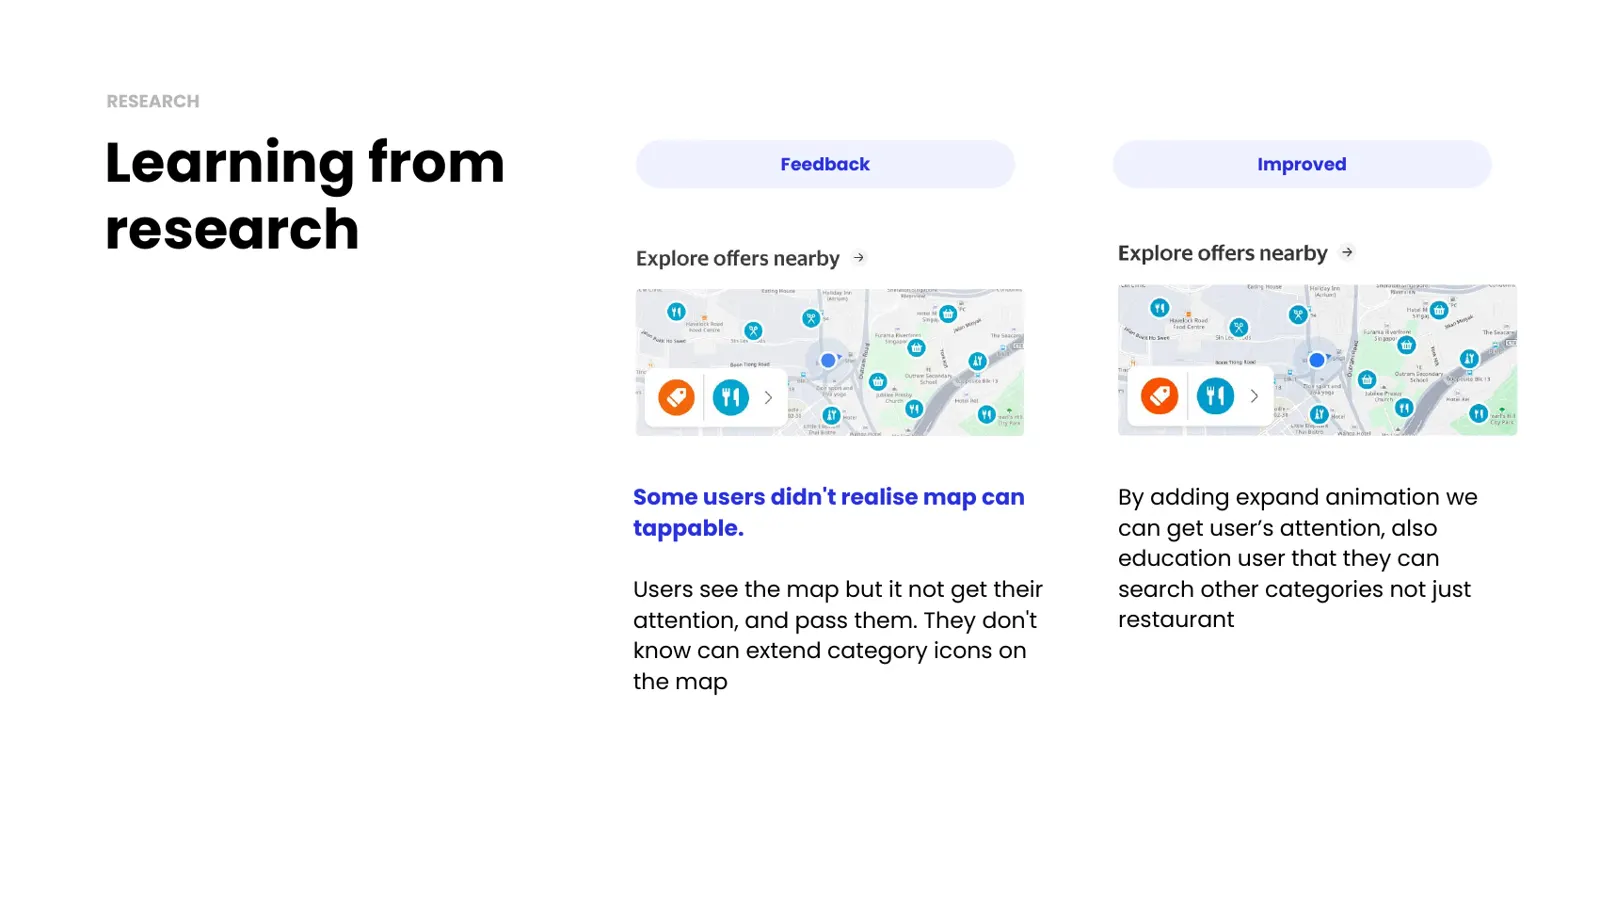
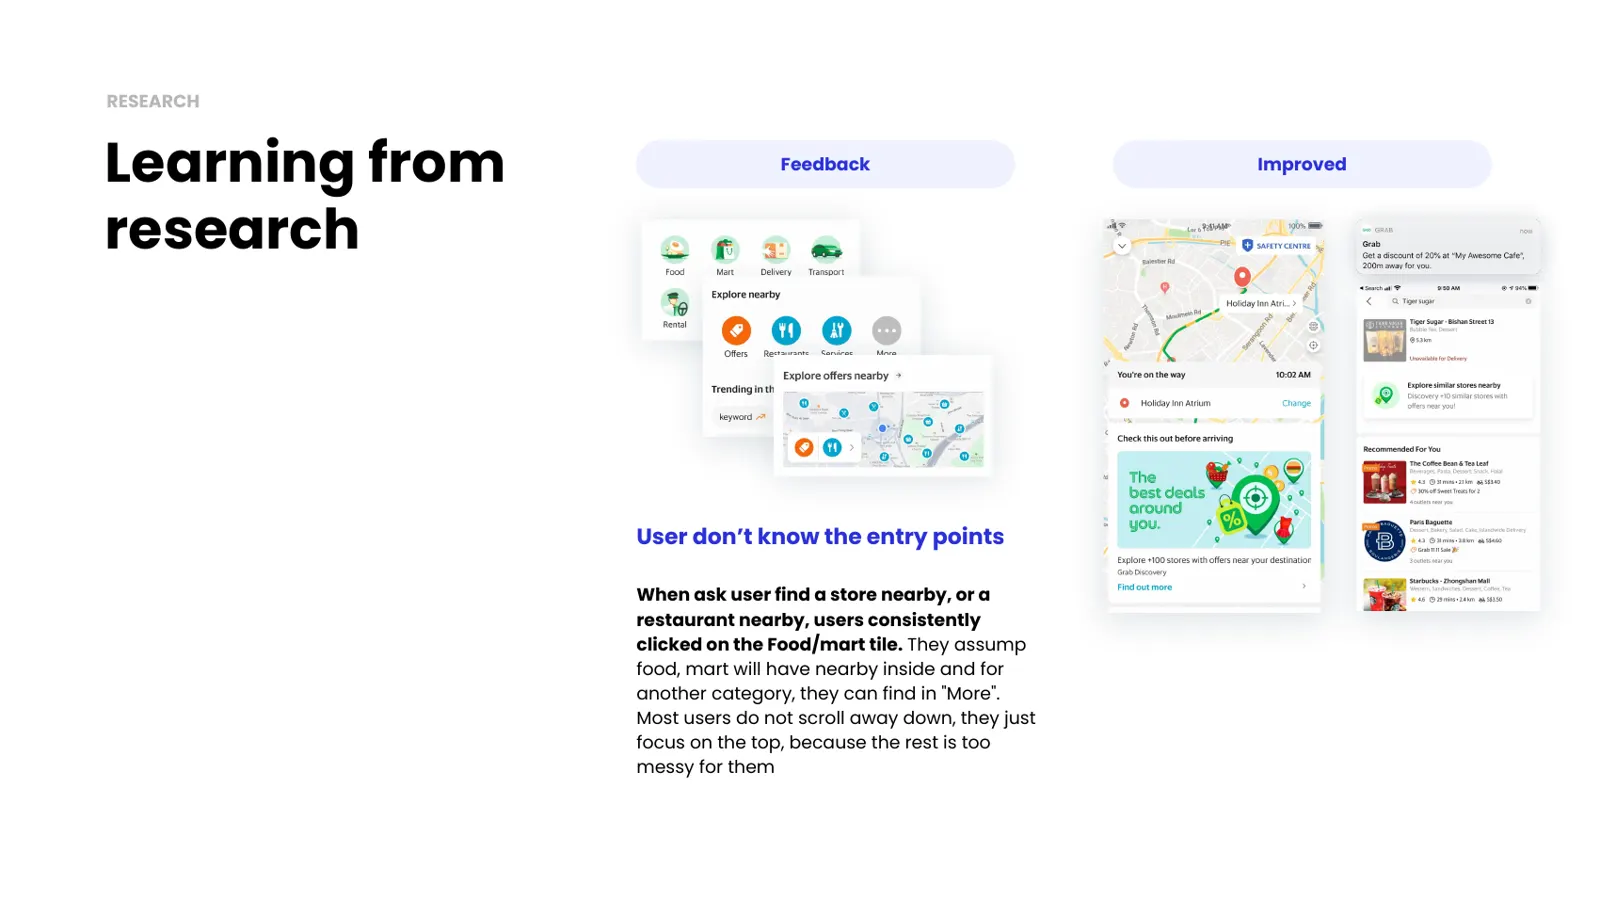
Some users did not realise the map was tappable, so I added an expand animation. Others went straight to the Food or Mart tiles to look for nearby places, and few scrolled down the homepage.
Next iteration
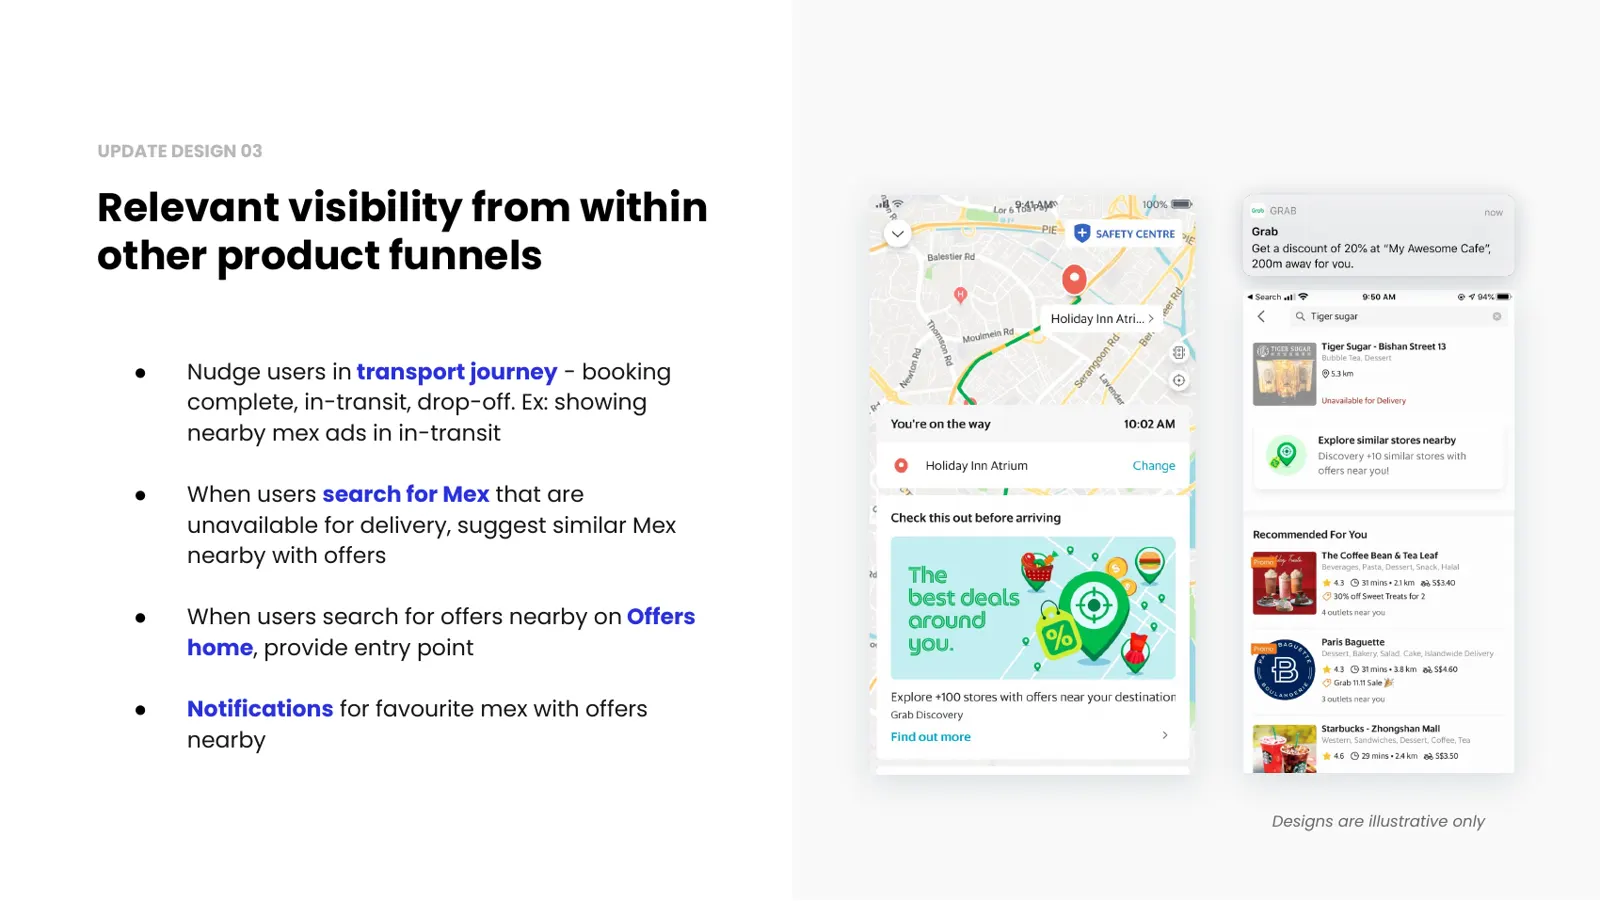
Showing up inside other journeys
I proposed nudges where intent already exists: during a ride, when a store cannot deliver, on the offers page, and as notifications for favourite stores.
Results
Experiment in Singapore, 20% of users
$0.20 → $5.03
Revenue per user increase
Revenue per user increased +2,145%, thanks to unified GrabPay, self-pickup merchants and offers discovery.
25.5% → 46.6%
Overall engagement rate increase
Overall engagement rate increased +21.11pp, including Homepage and Nearby.
25.5% → 34.8%
Homepage engagement rate increase
Homepage engagement rate increased +9.3pp thanks to map visibility, not including Nearby.
1.26% → 0.38%
Lower homepage entry point CTR
Entry point CTR was lower because users didn’t recognise the new entry point as Nearby. The experiment also ranked it high, so far more users saw it (1.41M) than in the control group (82.4K).
Next steps: teach users about the new entry point and aim for full release in SG, MY and PH.